Visualization
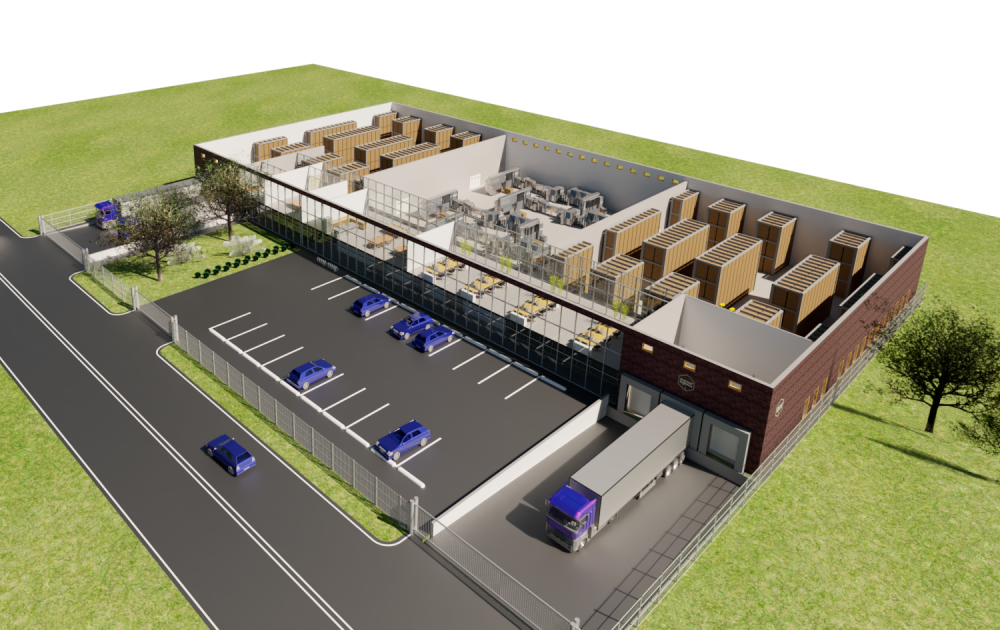
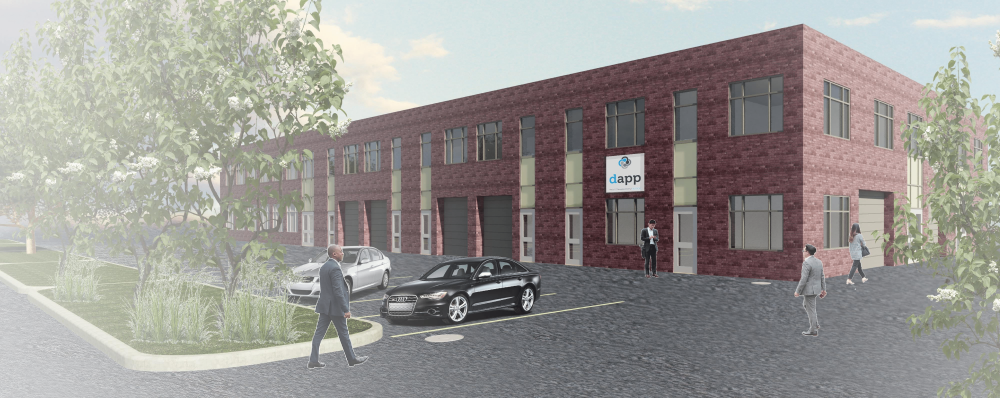
The saying "a picture says more than a thousand words" will probably not sound unfamiliar to you. By visualizing ideas, concepts and effects it is possible to determine at a glance how certain concoctions will look or function in reality.
These visualizations can take the form of, for example, a 3D model. However, this is not all. Some less static examples of visualizations we can create are 3D video walkthroughs or a 3D timelapse of a warehouse or facility. Another example of the versatility of a 3D visualization is that it can serve as a backdrop for 2D images of your facility. In this way, Dapp can use a variety of tools to bring your idea or concept to life, also making it easier to discuss within the organization.
Another form of visualization is making certain data transparent. Data on its own does not say much. To do something with this data, context is needed. Analyses will have to be made in order to extract information from the data. These analyses, in turn, will reveal certain connections. Again, however, these connections can be better presented than described: seeing is believing. For this reason, Dapp not only performs data analyses but also data visualizations. The data obtained is processed in a range of interactive graphs that look a bit like a dashboard. In this way, it is also clear to someone who is not deeply into the matter that certain connections exist because the conclusion can be drawn visually. This reduces the resistance to certain decisions and makes the data more open for discussion.
Curious what Dapp can do for your company in the area of visualisation?
Contact us via +31(0)345 50 52 56.
Or take a look at the other engineering services we offer. You can find them here.